 A Google search for websites containing both the words “travel” and “diarrhea” results in 1,860,000 links, and that only includes the small subset of pages in which “diarrhea” is spelled correctly. The Centers for Disease Control and Prevention (CDC) estimate that there are 50,000 new cases of traveler’s diarrhea every day (CDC 2008). One might expect, therefore, that a wealth of information must be available to help the cautious traveler assess risk levels of potential trips. After all, a careful consideration of the risk of traveler’s diarrhea is at least as important as a consideration of the number of national parks or pristine beaches a travel destination offers, because the traveler’s intestinal state is likely to determine whether those parks or beaches will even been seen by the traveler.
However, most travelers just go to one country for a week or two, and although many return with a disgusting story, virtually none have actual data to go along with it. As a result, little objective data is available for use in risk assessment. The few previous studies have identified travel destination as the most important risk factor (Steffen et al. 1983; von Sonnenburg et al. 2000). The CDC has therefore divided the world into three categories with regard to risk for developing traveler’s diarrhea – high, intermediate, and low (CDC 2008). High-risk areas include Mexico, all of Central America, all of South America (except Argentina and Chile), all of Africa (except South Africa and Lesotho), and all of Asia (except Japan and Russia). In other words, 78,846,672 square kilometers of the Earth’s land surface, or 58.2% of the total land surface (excluding Antarctica, which CDC does not categorize), are classified as high-risk areas.
This qualitative, broad-brush approach to risk assessment is unfortunately not very useful to the traveler. Diarrhea can range from the merely annoying to the completely incapacitating, yet CDC makes no attempt to classify severity. As a result, there is little information that would help you plan a trip unless you automatically exclude a visit to 58.2% of the world. There is an urgent need for a universal, quantitative, objective methodology for rating countries so that travelers can accurately assess the likelihood of developing an urgent need at each potential destination.
During a recent trip to Latin America, I had quite a lot of time to sit and think about this issue on the very first day due to a bad tamale I ate at a bus station, and I realized I had an opportunity to begin solving this problem by determining which is the crappiest country in Latin America.
Methods
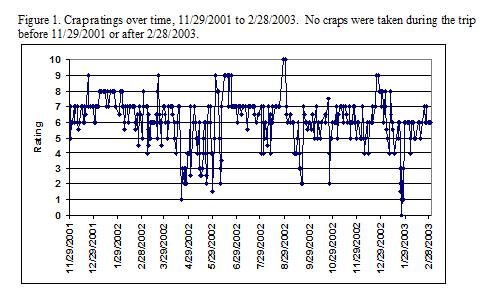
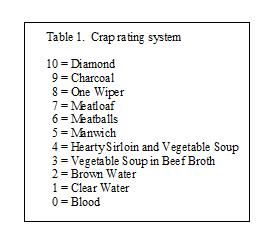 I traveled from Tucson, Arizona, USA to Buenos Aires, Argentina, mostly by bus, between November 28, 2001 and March 3, 2003. I rated every bowel movement I had during that 15 month period according to the scale displayed in Table 1.
I did not visit every Latin American country, so several countries are excluded from the analysis. Furthermore, due to an imminent mortar attack on the capital city, I remained in Colombia for just three days and excluded it from the analysis due to the low sample size. The countries included in this study are Argentina, Brazil, Costa Rica, Guatemala, Honduras, Mexico, Nicaragua, Panama, and Venezuela.
The rating scale was initially designed as a negative logarithmic scale in terms of looseness, much like a pH scale is a negative logarithmic scale in terms of acidity, with 1 being the most loose and 10 being the least loose. However, when I devised the scale I did not realize it was possible to crap straight liquid blood, so during the course of the study I had to add a zero rating. While this does mean that the scale can no longer be considered truly logarithmic, the change does not affect the analysis or results.
The advantage of the non-linear scale is that it allows us to focus more closely on the looser end of things. Therefore, the “one-wiper,” the Holy Grail of crapping, is not a 5, but an 8. Generally speaking, the further from 8 you are, the less comfortable you are likely to be. The ratings are designed to be self-explanatory and objective. Fractional ratings, such as 4.5, were permitted when necessary. When there were multiple bowel movements in the same day, I rated each separately.
To compare countries, I used multiple regression to determine whether there were rating differences between them after accounting for differences in the number of days spent in each country and in the number of months I had been traveling when I visited each country.
One potentially confounding factor is that I occasionally used ciprofloxacin, an antibiotic, to combat various illnesses during my trip. I typically took antibiotics for three days each time, and started treatments on December 29, 2001 (Mexico); May 15, 2002 (Honduras); December 19, 2002 (Brazil); and January 26, 2003 (Argentina). However, given that the effective period of the antibiotics was short compared to the length of time spent in any country, I have disregarded this factor in the analyses.
Results
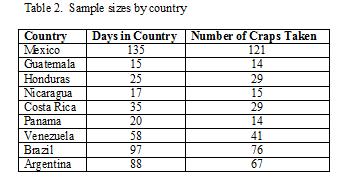 In total, I produced 406 craps during my 490-day trip. Table 2 lists the countries visited in order of visitation, days spent there, and craps taken in each.
During the course of my trip, I produced craps that spanned the entire rating scale, from 0 to 10 (Figure 1).
Countries differed significantly in terms of level of crappiness (F = 18.20, df = 7, 396, P < 0.0001), even after taking number of days in country and number of months on the road into account.
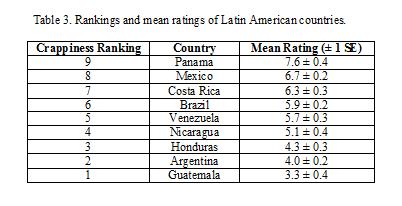 The country with the lowest rating (i.e., the crappiest) was Guatemala, scoring a craptacular 3.3, which is just barely more solid than vegetable soup in beef broth (Table 3). Argentina was the second crappiest country I visited, where the mean looseness of my craps was the same as hearty sirloin and vegetable soup. Argentina was closely followed by Honduras. Argentina was the only country in which I produced craps with a zero rating (blood). Argentina and Guatemala were the only countries in which I achieved ratings of 1 (clear water), although there was one 1.5-rated crap in Nicaragua.
The least crappy country I visited was Panama, which scored well ahead of all other countries at a breathtakingly pleasant 7.6 (between meatloaf and one-wiper). Following Panama was Mexico, with a 6.7 rating, and Costa Rica, with a 6.3. Venezuela was the only country in which I produced craps with a 10 rating (diamond), but I achieved at least one 9 rating (charcoal) in Brazil, Mexico, Nicaragua, and Panama.
Discussion
 Keeping in mind that I only sampled nine Latin American countries, the data indicate that Guatemala is by far the crappiest country in Latin America. Interestingly, Argentina is the only country I sampled that is considered by CDC to be an intermediate risk rather than high-risk country for traveler’s diarrhea, yet Argentina is the second worst country for diarrhea according to my study.
Mexico has long been feared by American travelers as a place of intestinal unpleasantness. Hence one often hears of Montezuma’s Revenge, which attributes the experience of pissing out of your rectum to a curse the last Aztec emperor placed on foreign visitors. Nonetheless, this study indicates that Mexico is in fact among the least crappy countries in Latin America.
Although 406 craps were analyzed for this study, all were produced by the same person, which technically means that the results of this study can only be directly applied to me. However, the data are likely to be generally applicable to other people as well. As such, I recommend Panama as the Latin American destination of choice to those travelers who wish to tour more than just a country’s toilets, and I submit that spending a week in your own bathroom will provide a similar experience to a week in Guatemala at a much lower price.
Most importantly, this study proves that it is possible to differentiate between countries with a simple, objective rating system. Please note that Table 1 can be easily printed out, laminated, and carried in the field. If this rating system is used by other researchers in the future and the results published, we will be able to someday determine which is the crappiest country in the world.
Sources cited:
Centers for Disease Control and Prevention (CDC). 2008. CDC Health Information for International Travel 2008. Atlanta: US Department of Health and Human Services, Public Health Service.
Steffen R., F. van der Linde, K. Gyr and M. Schar. 1983. Epidemiology of diarrhea in travelers. Journal of the American Medical Association 249(9): 1176-1180.
von Sonnenburg, F., N. Tornieporth, P. Waiyaki, B. Lowe, L.F. Peruski Jr., H.L. DuPont, J.J. Mathewson, R. Steffen. 2000. Risk and aetiology of diarrhoea at various tourist destinations. Lancet 356: 133-134.
photo by nicolasnova on Flickr